10 Ways the PowerScout 12 HD Solves Common Metering Challenges

INTRODUCTION:

If you’ve spent time sourcing and installing power meters, chances are you’ve run across the same challenges over and over again. Choosing the right meter, much less install it, can be tricky business. Even so, a little planning and the right power meter, can go a long way to making life easier.

We have spent years listening to customer feedback and carefully designing our latest PowerScout HD meters to ease the burden of many common problems. See how the PowerScout 12 HD can simplify your next metering project.

1. METER INSTALLATION IS PRONE TO ERRORS

The PowerScout 12 HD meter includes DENT’s patented PhaseChek feature that confirms proper CT orientation during installation. The display on the submeter shows real-time information about metered values and setup information. By reviewing real-time information on the display or connected laptop, it’s easy to double-check to ensure that metered values make sense prior to leaving the installation site. If a setting needs to be changed, the user can connect to the meter using USB or Ethernet to make adjustments in real-time, avoiding expensive and time-consuming trips back into the field.

In addition, if a CT is discovered to be on backward after the installation is complete, the direction of the CT can be reversed through a user configuration register designed for this purpose, called the “flipper.” This handy feature further eliminates special trips back into the field.

2. POWER METER CONFIGURATION IS TOO COMPLICATED

Thanks to ViewPoint HD software, the PowerScout 12 HD is easy to pre-configure before heading to the installation site. Connect the device to a PC using a USB or Ethernet cable to preset important metering parameters, such as service types, amperage ranges, communication options, and other variables. Save the setup to your computer to be used on multiple meters.

Additionally, it is now possible to configure the PowerScout 12 meter without even having it connected to your computer. Simply start ViewPoint HD software and create a configuration file to be sent to the meter at a later time. This feature is especially helpful for teams who handle configuration and installation in two separate steps.

Rather than configuring the device through a complicated push-button interface, the use of ViewPoint HD software simplifies submeter configuration. The intuitive interface allows for setup of measurement types, communications, and alarms. It also allows for seeing real-time information about the service under measurement including harmonics. Harmonics and waveform capture are also available in real-time.

ViewPoint HD software also includes a context help feature that guides users as they use the software, allowing for rapid and accurate configuration. A pop-up window with technical and Modbus register/BACnet object description information appears any time a screen object is hovered over with the mouse cursor.

3. THE INSTALLATION SITE ALWAYS HAS UNFORESEEN CHALLENGES (I.E., COMMUNICATIONS METHODS OR AMPERAGE RANGES WERE UNEXPECTED)

The PowerScout 12 HD combines popular, standard features across all models. Instead of having to choose between Modbus or BACnet, Serial or Ethernet, the PS12HD includes all these options as standard.

In addition, the PowerScout 12 HD is fully compatible with the full range of DENT current sensor options, including Rogowski (RōCoil) models. From building mains to lighting loads, mix-and-match all CT options across the meter to measure both high and low amperage loads simultaneously.

The PowerScout 12 HD may also be used on any voltage service, from 90-600VAC. The submeter is line-powered off the service under measurement.

4. THE METER NEEDS TO BE SECURE (TAMPER RESISTANT)

The PowerScout 12 HD meter has two levels of PIN protection that users can choose to assign for restricting access to submeter information. Users can be set with “read-only” or “read/write” access to the device.

Additionally, the meter may be ordered as a “no display” model, which eliminates the LCD and push buttons on the front of the device. This configuration discourages casual interaction with the meter. Interactions with “no display” versions of the meter must be made through a direct connection (USB or Ethernet) or RTU over a network.

5. I NEED TO PERFORM PREDICTIVE MAINTENANCE ON MY SYSTEM

Keep an eye on critical systems. New to the PowerScout 12 HD is the capability to set alarms on any submeter channel. Alarms may be configured to trigger by voltage and/or current over and under events. Customize the persistence setting and other parameters using ViewPoint HD.

6. I THOUGHT I NEEDED TO MEASURE X AMPS ON MY BUILDING, BUT REALIZED DURING INSTALLATION IT WAS Y AMPS

CTs may easily be swapped on the PowerScout 12 HD. The meter is not factory-configured for a particular CT type or amperage range. Instead, any DENT CT (333mV output or Rogowski coil) may be used on any submeter element. CTs may be swapped in the field with minimal effort – just use ViewPoint HD software to make adjustments to the configuration on the fly. Measure up to 4000A using Rogowski (RōCoil) CTs.

7. I NEED TO CORRELATE MY CONSUMPTION OF UTILITIES WITH ELECTRICITY

Standard on the PowerScout 12 HD are four pulse input channels which allow for the correlation of consumption of a variety of systems using standard, dry-contact pulse inputs. Configure each of the input channels independently with customizable units of measure (i.e., gallons) within ViewPoint HD software.

8. I NEED A SUBMETER THAT IS REVENUE GRADE

The PowerScout 12 HD is ANSI C12-20-2010 Class 0.2. When paired with a revenue grade current sensor, such as the DENT RoCoils or revenue grade split cores, the meter has best-in-class accuracy, ideal for any application where precision is critical.

9. I NEED TO MONITOR SEVERAL DIFFERENT LOADS IN MY PANEL SIMULTANEOUSLY, INCLUDING THE BUILDING MAINS

The PowerScout 12 HD is capable of monitoring 12 current channels simultaneously on services up to 4000A. It can monitor up to 12 single-phase or 4 three-phase loads, or a combination of single and three-phase loads (e.g., 6 single-phase loads, plus 2 three-phase loads).

10. MY METER LOST ITS CONNECTION TO THE RTU AND I NEED A RECORD OF KWH

The PowerScout 12 HD maintains an internal log of the energy data (net kWh) for each channel in the submeter that is updated every 15 minutes. This log is always active and requires no configuration. It stores 63 days’ worth of 15 minute data in its memory. The data can be retrieved by users looking to restore gaps in data collection where RTUs may have been offline or communication was interrupted. The file may be downloaded as a CSV (comma separated value) file through ViewPoint HD software. Multiple files may be combined as necessary.


CONCLUSION:

The ideal size for projects large and small, the PowerScout 12 HD is designed to monitor multiple independent loads on a single submeter. Lower installation and commissioning costs while benefiting from revenue-grade accuracy in a wide variety of large building environments including multi-tenant residential, commercial, industrial, retail, and more.

Learn how the PowerScout HD can be a valuable addition to your metering toolkit. Contact us for a quote today.

Announcing the All-New PowerScout™ HD Multi-Circuit Power Meters

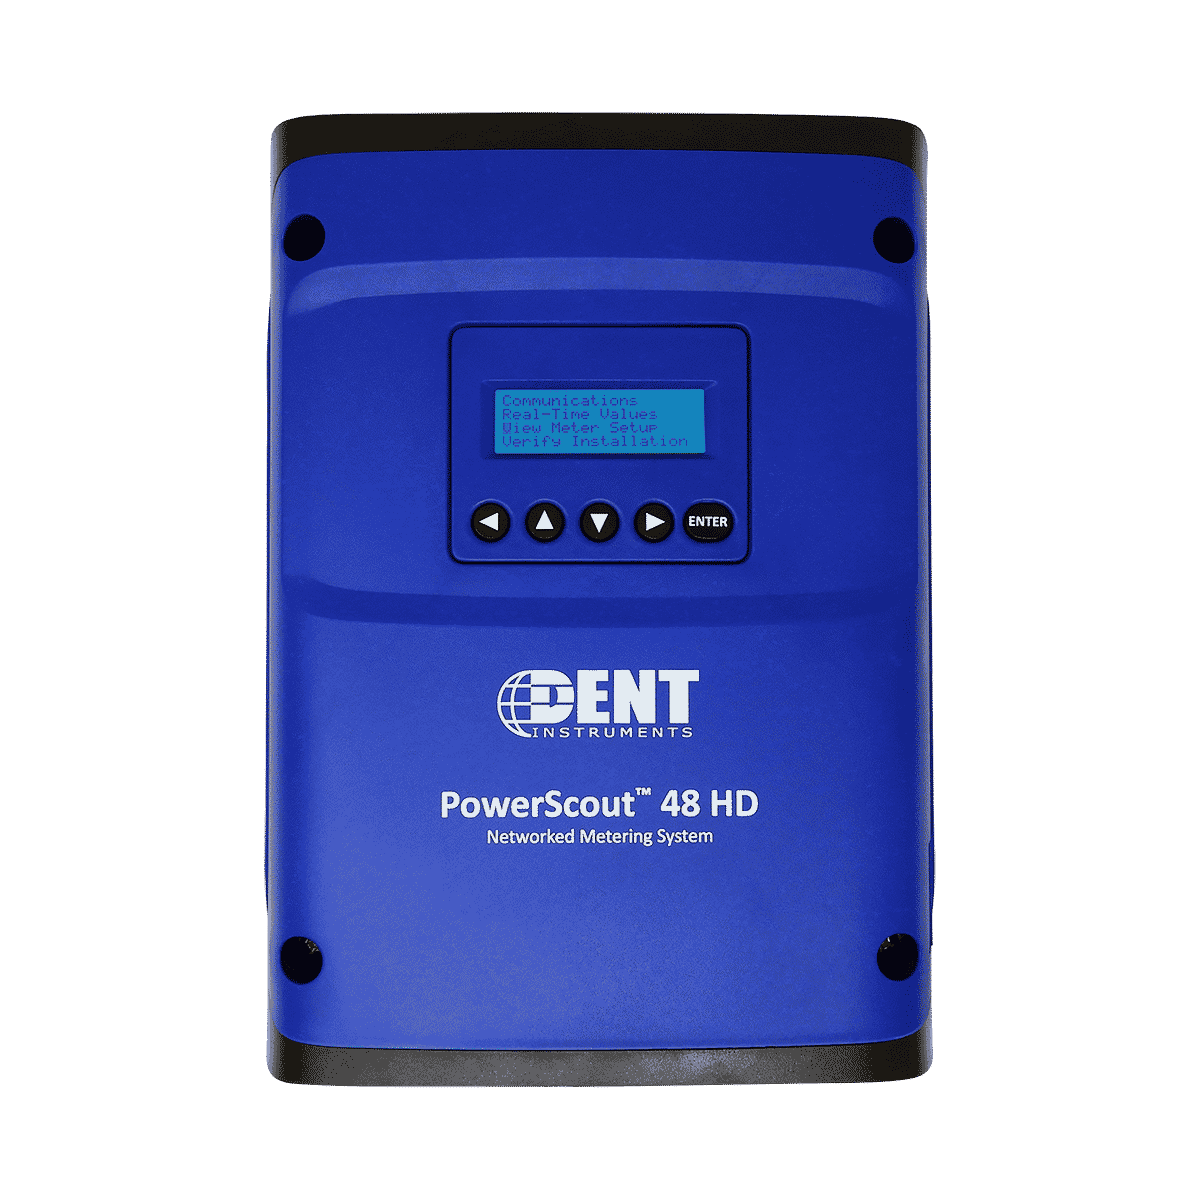
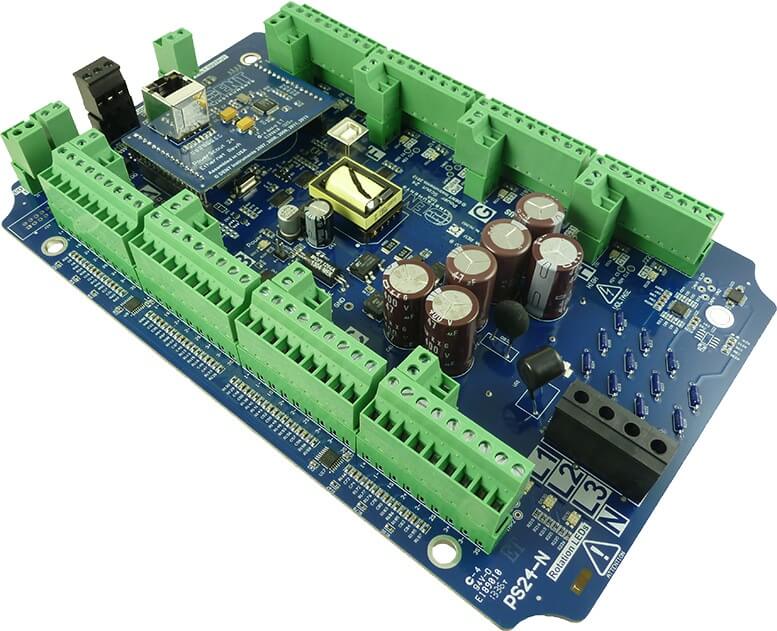
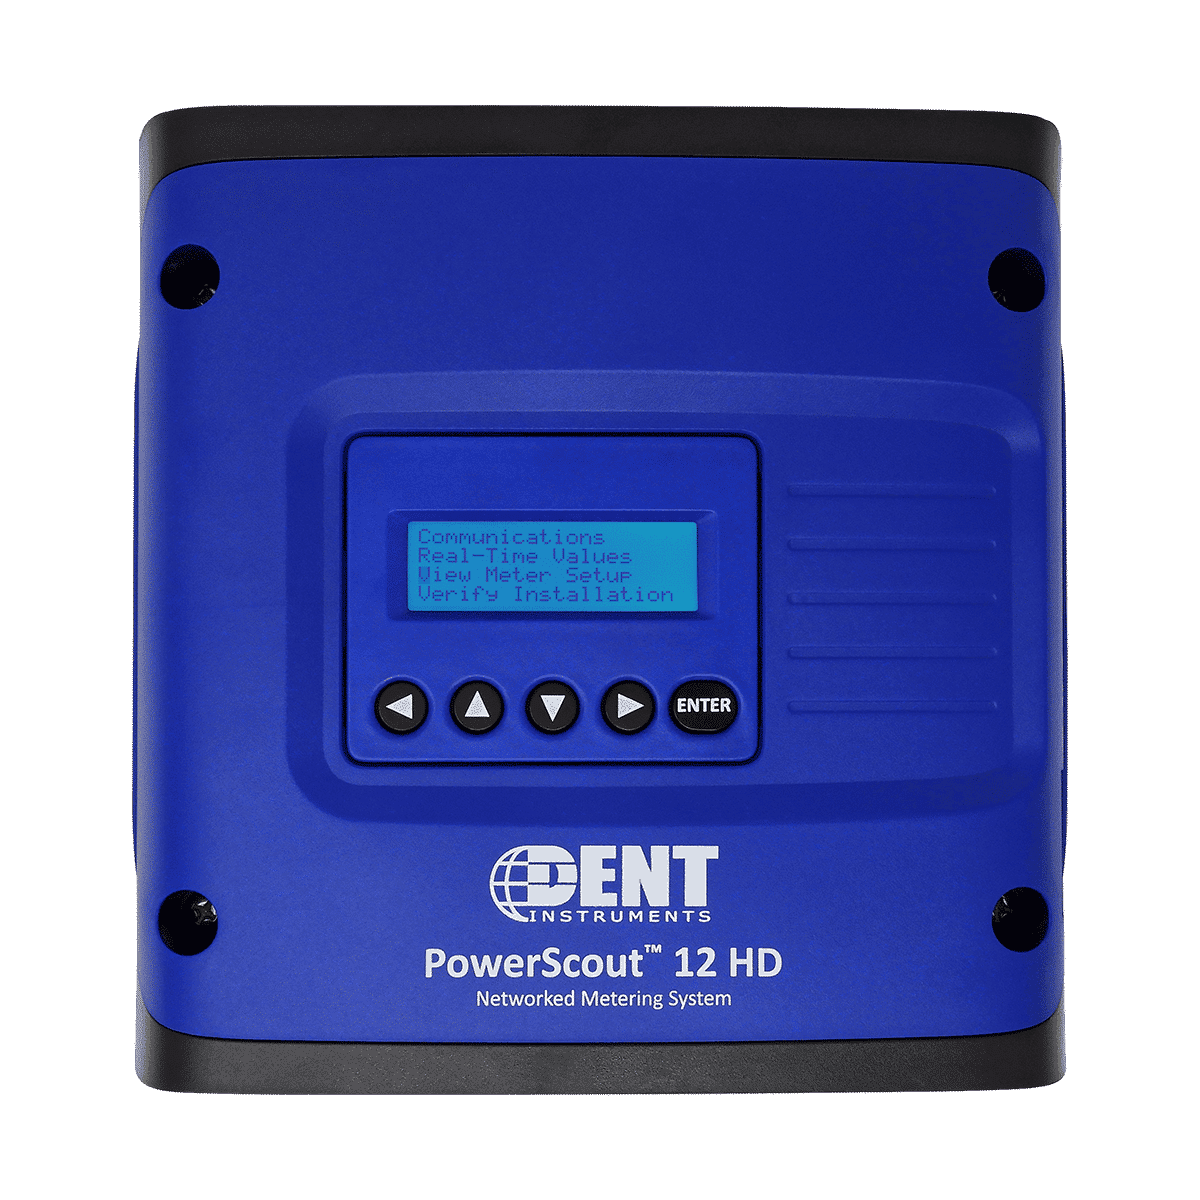
48 SINGLE-PHASE/16 THREE-PHASE METERS BY INSTALLING A SINGLE DEVICE

Announcing the all-new PowerScout™ HD Series Multi-Circuit Power Meters. Designed to monitor multiple independent loads from a single meter, the PowerScout HD Series makes it easy to add many revenue-grade metering points without having to purchase, mount, wire and commission individual energy meters, resulting in lower overall installation & commissioning costs.  The PowerScout HD solution provides revenue-grade accuracy in a wide variety of large building environments including data centers, hospitals, office buildings, campuses, retail centers, and industrial complexes. The PowerScout HD Meters replace all previous-generation DENT multi-circuit meters, including the PowerScout 24.

TWO HD MODELS TO SUIT ANY INSTALLATION

One size doesn’t fit all, which is why the PowerScout HD comes in two sizes: PowerScout 12 HD has 12 circuit channels while the PowerScout 48 HD has 48 circuit channels. Both meters can be used on any combination of single- or three-phase installations and are available in a “circuit board only” or enclosure style options. Save on equipment and installation costs: the PowerScout 48 HD has a unique, two independent voltage input design, allowing it to be used on two voltage services simultaneously. The circuit board only models can often be mounted directly in the panel being monitored or in the optional enclosure and require less physical space than individual meters.

MINIMUM PART NUMBERS, MAXIMUM FEATURES

Keep it simple: Don’t fight with a long list of SKUs only to realize an important feature is missing. All PowerScout HD Series Meters are equipped with smart, standard features like the flexibility to switch between Modbus® or BACnet®, Ethernet or Serial (RS-485), or the ability to use any millivolt CT, including Rogowski coils, on any channel.  When installed, the platform agnostic PowerScout HD Series meter easily integrates within connected products of any building management system (BMS) software, models equipped with BACnet® and Modbus® protocols and can be easily utilized with any system.


Start Shopping Now

SEE HOW WE STACK UP TO THE COMPETITION

Want more information? Contact our sales team today!

DENT Attends the CGNA Synergy Conference

Last April, DENT attended the Controls Group North America (CGNA) Synergy Conference in Savannah, GA. This conference was a meeting of the top manufacturers and distributors in the controls industry and terrific opportunity to showcase DENT PowerScout meters and accessories to other CGNA members.

Thanks to Eric Stromquist for capturing our newest PowerScout 3037 video! DENT Power Meters Rock – We could not agree more!

https://youtube.com/watch?v=3WtHd-Z3IHU%3Frel%3D0

Energy & Electrical Submetering: Making the Submeter Case

Today’s escalating energy costs put increasing pressure on businesses and organizations to proactively manage their energy use. There is a growing sense of urgency to understand energy consumption patterns and to develop effective actions to manage their associated expenses.

Gaining the upper hand on electrical costs often begins with some comprehensive detective work: Taking measurements, locating energy hogs, and understanding time-of-use issues. As facility managers, engineers, and electrical supervisors know, the price of electricity is more than simply a matter of cost per kilowatt hour. Peak demand charges and power factor penalties can drive operating costs through the roof.

Load profile studies and energy audits can provide the baseline data necessary for a comprehensive energy management program. Armed with solid data, energy managers find it possible to reduce demand, contain costs, improve equipment performance, identify energy conservation measures, and curtail use during periods of high energy costs.

WHAT IS SUBMETERING?

Submetering refers to the monitoring of consumption of individual equipment within a building. In the

case of electrical submetering, the equipment being monitored may include HVAC, lighting, or kitchen/refrigeration. Utility submetering also allows a landlords or property owners to monitor consumption

in order to bill tenants for individual utility usage.

Obtaining usage and consumption data by submetering is sound business practice. Submeter benefits can include capturing lost revenues from retail, building, and department tenants, verifying cost savings on capital projects, scheduling preventative maintenance on equipment and optimizing performance of the entire facility.

BENEFITS OF SUBMETERING

  • Quickly identify whether equiment is being left on during the night or over the weekend
  • Compare usage across similar facilities, such as other branches or store locations
  • In-depth view of facility energy data in real-time
  • Identify maintenance issues before equipment failure
  • Provide facility managers with feedback on which changes are working and what to do next

Have you incorporated submetering into your energy management program? Do you rely on spot metering to compliment your submetering strategy? If you’re looking for a solid submeter solution, DENT Instruments can help. Please contact us to learn more about our PowerScout meters and flexible RoCoil (Rogowski) current transformers.

Migration Guide: Switching from the PowerScout to PowerScout HD Series Meters

Are you an existing PowerScout user who is looking up add the PowerScout 12 or 48 HD to your toolkit? Or, maybe you’re swapping out a PowerScout 3037 and upgrading to a multi-channel PowerScout 48 HD? Before you do, you should note that there are important differences between the PowerScout and PowerScout HD Series meters. Don’t worry – we’re here to help! We’ve put together some helpful information to help you migrate from first/second generation PowerScout meters (PowerScout 3, 3+, 3037, 18, and 24) to the PowerScout HD Series (PowerScout 12 HD and PowerScout 48 HD).

Below, you will find a series of tables that breakdown the differences between the two meter types. You’ll see right away that there are differences in installation, communications, programming, and registers. These differences are important to keep in mind during meter selection and configuration.

But first, here’s a little more information on the main differences. Full information can be found in our PowerScout to PowerScout Migration Guide.

  • The Modbus register and BACnet Objects schemes are different between the PowerScout 3037/24 and PSHD meters. The PSHD meters now report all data in floating point format which requires less manipulation (such as scaling) by the host RTU. Register organization has been improved by adopting the SunSpec three phase net metering model as a basis.
  • The Windows® configuration utility “ViewPoint HD” is not compatible with PowerScout 3037/24 and can only be used with PSHD meters. PowerScout 3037/24 devices must continue to use legacy ViewPoint 4 software.
  • New capabilities. The PowerScout HD Series has expanded upon the feature set of the PowerScout series by adding Alarms, Interval Data Recording, and Pulse Inputs. Along with new features comes new analytics such as THD, Theta, and installation diagnostics.
METER CONFIGURATION DIFFERENCES
METER INSTALLATION DIFFERENCES
VERIFICATION & COMMUNICATION DIFFERENCES
RTU PROGRAMMING & SCRIPTING DIFFERENCES
RESOURCES

Please review all documentation prior to working with or installing the PowerScout HD. For technical support, please contact us.

Multi-Circuit Submetering: A Cost-Effective Solution for Electrical Load Profiling of Hospital Emergency Power Supply System Loads

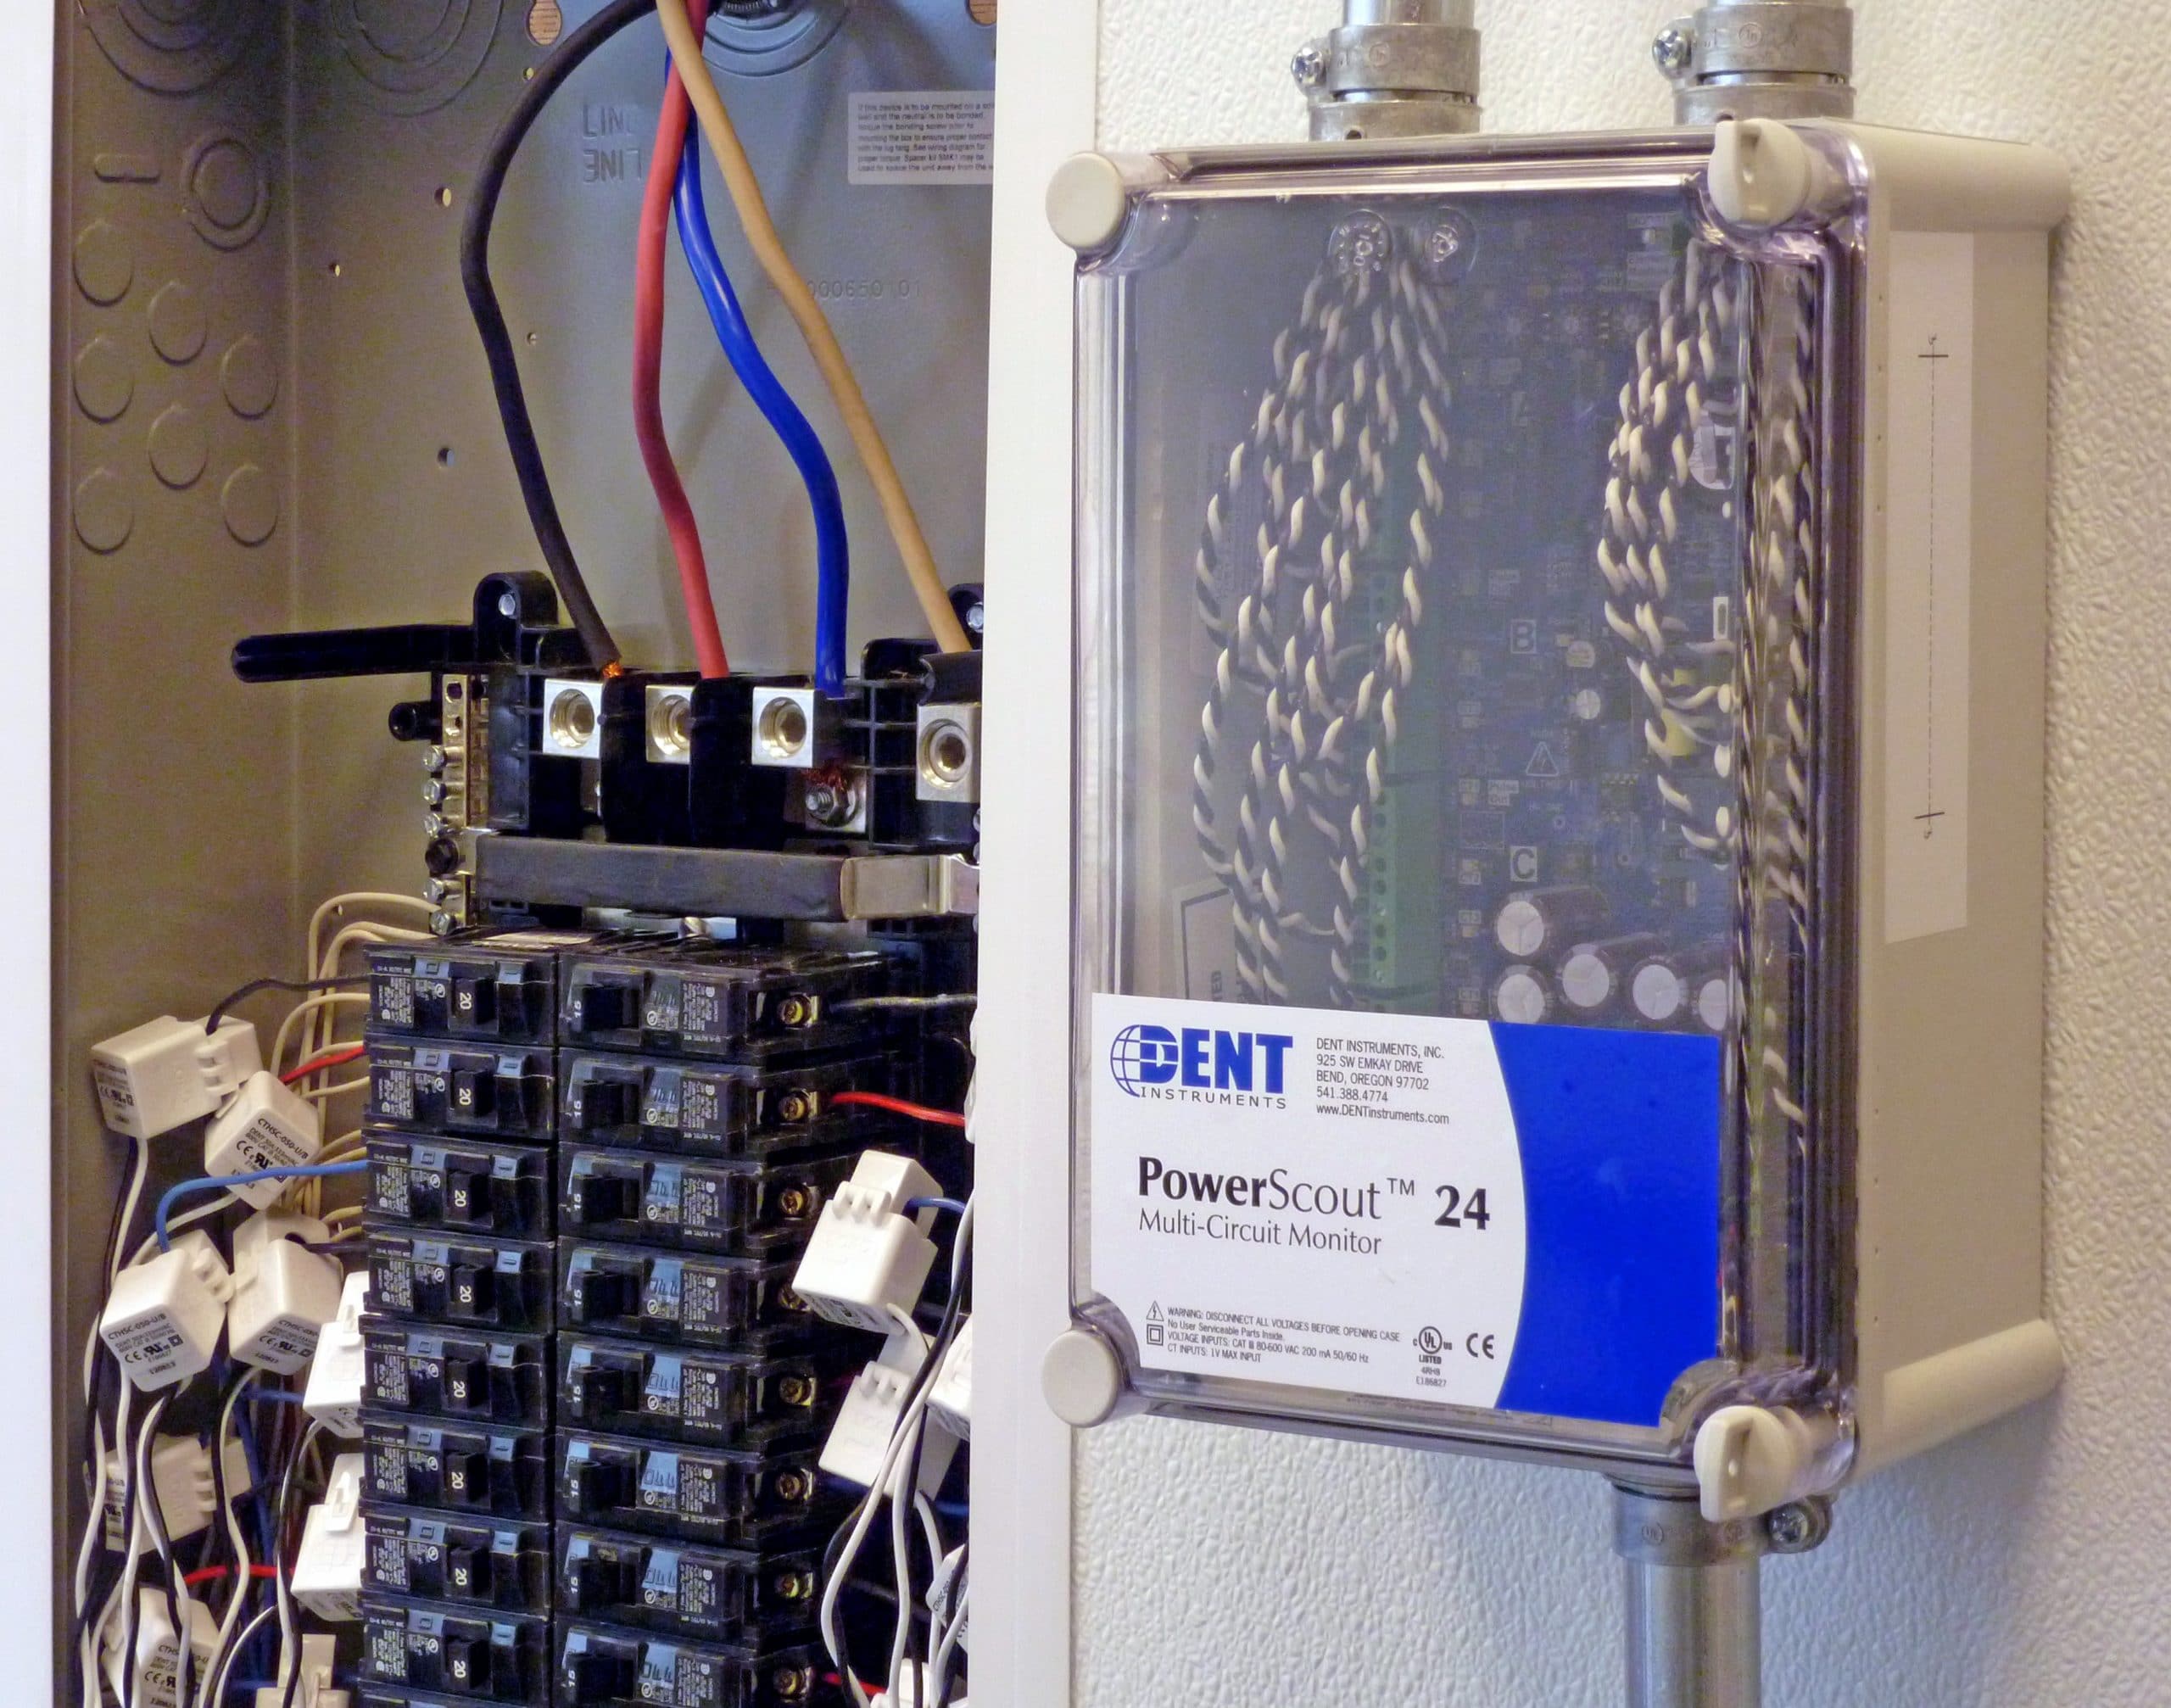
By: Zack Smith & Allan Evora, Affinity Energy

ATS MULTI-CIRCUIT METERING HELPS EFFECTIVELY MANAGE LOAD CREEP

Emergency Power Supply Systems (EPSS) are the critical infrastructure that supports a hospital system during power outages. Regulations place a lot of emphasis on testing and maintenance of the EPSS system; however, all the maintenance in the world will do no good if the EPSS becomes overloaded.

EPSS experience load creep like normal power systems. Additionally, they run the risk of reduced capacity due to the addition of non-essential loads plugged in to designated red receptacles during extended outages. These loads may consist of diagnostic equipment or in some cases “comfort equipment” such as microwaves, heaters or coffee pots. Education and training can help ensure only approved loads are plugged in to EPSS.

Submetering is the only way to truly manage load creep and prevent EPSS overload.

YOU CAN’T MANAGE WHAT YOU DON’T MEASURE

The best way to manage your capacity is to submeter your loads. For some hospitals, this is easier said than done. While you may have submetering information at the generator switchgear or even downstream submetering at EPSS distribution switchgear, the ideal location to submeter for managing load creep is the load side of the automatic transfer switch (ATS).

Newer ATSs (installed within the last 10 years) either have digital controllers that incorporate submetering as an option, or engineers had the foresight to specify that OEMs install a separate third party submeter with the ATS. Unfortunately, older ATSs need to retrofit submeters to be able to measure the ATS load. This can be a costly proposition when considering hardware and installation costs. The combination of OSHA regulations, and the fact that the ATS is part of critical infrastructure, can make modifying equipment challenging.

A COST-EFFECTIVE ALTERNATIVE TO CONVENTIONAL CIRCUIT MONITORING

Within the last five years, a new type of electrical submeter has emerged and is an ideal solution for retrofitting ATSs with submetering capability. This meter type is referred to as the multi-circuit or multiple circuit meter. The concept is simple: Use one submeter CPU/circuit board to measure multiple loads.

A multi-circuit meter has only one set of inputs for a common voltage source, and multiple sets of current inputs for loads that share the common voltage source. Due to limitations on current transformer (CT: the instrument that provides current input to the meter) lead wire length, the multi-circuit meter is best suited for loads in which the CT installation locations for the loads are near one another (typically within 100 ft.).

Examples include: submetering all the circuits within a distribution panel, or all the distribution panels within an electric room, or feeder breakers on a unit substation. Since ATSs tend to be concentrated in electric rooms and typically share a common normal and emergency voltage source, they are great candidates for multi-circuit submeters.

What makes multi-circuit submetering so cost effective? The lower hardware and installation costs. Additionally, since there is only one CPU/circuit board, there is only one low-voltage communication connection.

Our general rule of thumb: whenever you have more than two loads to submeter that meet the criteria for multi-circuit metering, go with multi-circuit metering. Its costs will be lower when compared to individual meters.

MULTI-CIRCUIT SUBMETER HARDWARE

The DENT Instruments PowerScout 24 is a great example of an inexpensive yet accurate submeter that provides all the measurements necessary for monitoring ATS loads. DENT Instruments was one of the first companies to introduce the multi-circuit design.

The PowerScout 24 comes with its own enclosure, is powered via the voltage source and easily integrates to your SCADA or building automation system via Modbus or BACNet. It can measure up to 8 3-phase loads. List price for a PowerScout 24 with serial communication is $1,200. A DENT PowerScout 3037 (the single circuit meter version) is $400.

Taking in to account installation costs, it is easy to see how the multi-circuit meter is a cost-effective solution when you need to meter more than two loads that meet the multi-circuit criteria. The cost savings are even more substantial as the number of loads increases. A fully provisioned PowerScout 24 will have approximately 66% lower hardware costs when compared to individual meters. Taking in to account labor savings, the total costs savings can be as much as 80-90%.

TURN THAT DATA INTO INFORMATION

Submeters provide data. To make this data valuable, it needs to be turned into actionable information. To accomplish this, we recommend a few additional steps.

First, we recommend that submeter data be recorded. To be of benefit, the load profiles need to be analyzed over time using trending software within your SCADA or building automation system. If you don’t have an existing system, there are some very cost effective data logging devices that can store a large amount of interval data. This data can generally be exported and analyzed with a desktop application such as Microsoft Excel. We also recommend that the ATS switch position and generator run status also be recorded.

Using this information, it would be easy to analyze the data to check the load prior to the ATS switching to emergency, the load while on emergency, and the load after the ATS returns to the normal source. Using this analysis, it’s easy to identify loads added during a power outage and not removed when normal power is restored.

Another easy way to spot load creep is to trend year over year load growth. Using this analysis technique, load creep is easy to quantify.

Ultimately, multi-circuit submeters are an easily installed, inexpensive way for healthcare facility managers to conduct accurate load profiling and analysis.

ABOUT AFFINITY ENERGY

Affinity Energy is a vendor-neutral control systems integrator with a national portfolio of over 800 power automation projects and a rich depth of expertise working with mission critical facilities, distributed generation plants, energy companies, engineering firms, and construction contractors who seek open, turnkey systems for power management and energy optimization.

Specifically, they work to design, build, implement, and support controls, instrumentation, and monitoring systems, during the design and/or build phases of a new construction or retrofit project for utility-scale solar farms, airports, waste-to-energy plants, data centers, medical campus central energy plants, and manufacturing companies.

See the original post on the Affinity Energy website here.

NIST Teams Up with Sparks Dynamics to Drive Down Energy Costs

CUSTOMER PROFILE

Founded in 1901 and now part of the U.S. Department of Commerce, NIST is one of the nation’s oldest physical science laboratories. Congress established the agency to remove a major handicap to U.S. industrial competitiveness at the time—a second-rate measurement infrastructure that lagged behind the capabilities of the United Kingdom, Germany, and other economic rivals. Today, NIST measurements support the smallest of technologies—nanoscale devices so tiny that tens of thousands can fit on the end of a single human hair—to the largest and most complex of human-made creations, from earthquake-resistant skyscrapers to wide-body jetliners to global communication networks.

THE CHALLENGE

Faced with an antiquated, inefficient compressed air system and the challenge of fully benchmarking the existing system performance, NIST knew they needed a professional energy ally so they could focus on what they do best—technology and standards development.

THE SOLUTION

NIST chose to work with Sparks Dynamics, who had the latest cloud monitoring technology and industry expertise to design, develop, operate and maintain the central compressed air plant serving the NIST campus. A month’s worth of compressed air system operating data was baselined using the ReMaster system and then a new compressed air system was designed and engineered to maximize energy efficiency and provide enhanced reliability for the plant.

The ReMaster system offers industrial customers a way to capture and analyze their system’s data. ReMaster uses Modbus communication and can collect data on energy, flow, pressure, and temprature, as well as control panel data. Energy data is captured using the PowerScout 24 Power Meter, which is built into the ReMaster system.

“Sparks Dynamics selected the PowerScout 24 for its ReMaster Cloud Monitoring Energy Management system for several reasons. We needed a cost-effective, multi-channel meter that was Modbus-capable and could handle 480V, 3-phase motors on compressors, chillers, pumps, blowers, and vacuum pumps,” says Mac Mottley, CEO of Sparks Dynamics. “The PowerScout 24 can monitor eight 3-phase motors for kW, Volts, Amps, and Power Factor and had a small form factor PCB design that could be easily mounted inside our ReMaster Panel.”

Sparks Dynamics managed the entire project and completed an energy study that resulted in a large Pepco (utility) rebate. The central compressed air plant was also designed with expansion in mind—33% more capacity to be exact, making it possible for NIST to supply compressed air to more laboratories as they are built and come online.

THE RESULTS

The new state of the art compressed air plant system was completed on time and on budget. In addition, Sparks Dynamics’ seamless integration and collaboration with the NIST’s contractors throughout the process helped ensure the project’s success – as the campus had to maintain compressed air service throughout the installation. As a result, Sparks Dynamics role has been expanded to include a remote monitoring contract utilizing the ReMaster cloud based monitoring and analytics solution.

WIN-WIN FINANCIAL FORMULA

Sparks Dynamics funded this project through two separate sources to ensure a totally complete system was provided. The first was using the standard government procurement RFQ process and the second was a Pepco rebate that paid for half of the total compressed air system equipment costs.

BENEFIT BREAKDOWN

  • 1,000 CFM of additional compressed air
  • Energy cost savings of $140,000 achieved per year
  • Received $370,000 Pepco Energy Rebate
  • Less than a 4-year simple payback

ABOUT SPARKS DYNAMICS

Sparks Dynamics is a compressed air management company that provides audits, remote monitoring and analytics services that notify and recommend corrective actions, enhanced control algorithms, equipment sourcing and energy financing.

Learn more at http://www.sparksdynamics.com/

PowerScout 3037 to PowerScout 3 HD Migration Guide

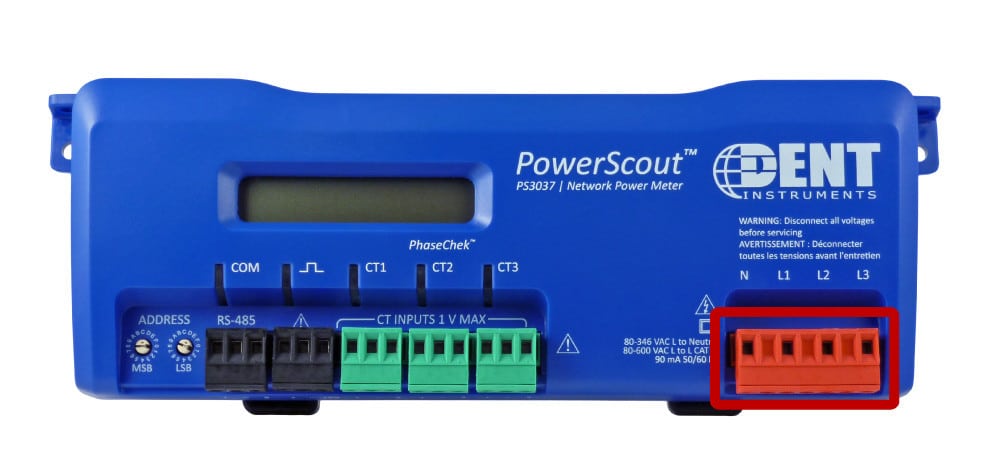
This guide defines key differences between the PowerScout 3037 and the updated PowerScout 3 HD meters. It is intended for current PowerScout 3037 users who are either replacing a PowerScout 3037 with a PowerScout 3 HD or working in an environment with both meter types.

For questions outside the scope of this guide, please refer to the PowerScout HD Manual or contact us.

DENT Instruments has responded to the growing needs of the energy and building automation control markets by introducing the PowerScout HD (PSHD) series of networked power meters.

The HD moniker reflects a “High Definition” design by bringing more points into a single meter and increasing data fidelity. While the original PowerScout series and the new PSHD series share many of the same popular features such as: being self-powered from line voltage, multi-protocol in all models, and ease of configuration, there are some important distinctions of which integrators and end-users need to be aware.

Main Differences: PowerScout 3037 vs. PowerScout HD

  1. The Modbus register and BACnet Objects schemes are different between the PowerScout 3037 and PowerScout 3 HD meters. The PS3HD meters report all data in floating point format which requires less manipulation (such as scaling) by the host RTU.Register organization has been improved by adopting the SunSpec three phase net metering model as a basis. The PS3HD register/object list is shared by all PowerScout HD meter models and is available as an Excel® document.The PowerScout 3037 and PSHD register space is non-overlapping so that both meter types can exist within the same network allowing for expansion with minimal disruption of existing scripts and programs.BACnet object types in PSHD have been updated to include all the Standard Objects in BACnet version 135-2016 including organization of elements through Structured View.
  2. The Windows® configuration utility “ViewPoint HD” is not compatible with PowerScout 3037 and can only be used with PSHD meters. PowerScout 3037 devices must continue to use legacy ViewPoint 4 software.PSHD meters can utilize updated ViewPoint HD software, which includes new analysis and troubleshooting features such as waveform capture, phasor plotting, and harmonic analysis. The PSHD meter can also be configured via a smartphone or tablet via the meter’s built in web server.
  3. New capabilities: The PowerScout HD Series has expanded upon the feature set of the PowerScout series by adding Alarms, Interval Data Recording, and Pulse Inputs. Along with new features comes new analytics such as THD, Theta, and installation diagnostics.

We have highlighted major differences between the product lines in a series of tables on the following pages. Please review this document, along with the PowerScout HD Manual, prior to working with or installing the meter.

Resources

Please review all documentation prior to working with or installing the PowerScout HD. For technical support, please contact us at support@dentinstruments.com.

PowerScout HD Manual

PowerScout HD Register List (Excel®)

Energy Management Case Study: Retro-Commissioning Service Cuts Energy Use

Two prominent grocery chains in the Upper Midwest are reducing their energy use and cutting energy cost by retro-commissioning their stores. The chains have done so with the help of SINGH360, a service provider that specializes in working with grocery chains, and the PowerScout 24 power meter.

The retro-commissioning process identifies opportunities to improve energy efficiency for stores that have been in operation for several years. The process is valuable because such stores tend to become less energy efficient with time, says Abtar Singh, president of SINGH360.

Strack and Van Til, a 37-store chain in Indiana and Illinois, recently hired SINGH360 to retro-commission 16 locations. As part of that process, the company upgraded system controllers to the latest software version. They put the energy-management system (or EMS) for each store on a network so that they can check and manage them remotely. They also implemented a system to control store lighting on an Energy Management System.

“In the last four months we’ve seen savings of 8% to 12% on average,” says Don Erminger, director of energy and maintenance. “Before the project, we expected a payback of two years. But after our first four months, we now think we’ll achieve full payback in 12 to 14 months. That’s twice as fast as we first projected, thanks to opportunities SINGH360 identified.”

Coborn’s, a 54-store chain headquartered in St. Cloud, Minnesota and operating in six states across the Midwest, recently retro-commissioned its first store. In addition to reducing energy costs and improving environmental sustainability, the company also benefited from addressing many maintenance issues, says Chris Braun, refrigeration project manager.

With the opportunities SINGH360 identified, plus a 75% utility incentive from Dakota Electric, the company expects payback in less than six months, Braun says. The project also identified added capital projects that could cut the company’s energy use by 20% to 25% during retro-commissioning, he says.

Such utility rebates often make retro-commissioning even more attractive.

Xcel Energy (http://www.xcelenergy.com/), an electric and natural gas utility that serves customers in eight states, provides attractive incentives for its customers. “Recommissioning can be a good way for supermarkets to save energy,” said Renae Wrich, Xcel Energy recommissioning program manager in Minnesota. “As an incentive for supermarkets to take action, we offer rebates to subsidize the cost of identifying and implementing energy-saving HVAC and refrigeration projects,” She said. Xcel offers recommissioning rebates in Colorado and Minnesota.

SINGH360’s retro-commissioning process is especially tailored to the needs of supermarkets, says Abtar Singh, president.

“We always involve a three-person team. They include a commissioning engineer, a refrigeration technician, and an electrician. They use a mobile app we developed to make the process thorough and consistent.

A DENT PowerScout 24 was used to submeter the mains, lighting, HVAC, refrigeration compressors, and condensers. The submetered data helped in three ways during the retro-commissioning:

  1. To quantify energy savings achieved during retro-commissioning
  2. To identify anomalies and help determine that lighting and HVAC were operating on the proper schedule
  3. To find optimum operating control parameters for the refrigeration system using the metered data

“The building owner uses that same data to protect their savings by continuous monitoring,” says Singh. “We selected the PowerScout because it provides easy installation and provides a rich set of data, such as voltage, current, and power factor.”

Each store takes about three weeks to recommission, Singh says. “First we dial in remotely to analyze the store’s energy management system (EMS). We prepare a game plan. Then our team spends a week in the store diagnosing and fixing problems. While we’re on site, we also fine-tune the EMS.”

“Then we further adjust the EMS remotely and monitor its performance to verify the changes are producing their intended effects,” Singh says.

“We create an issue list so the store owner can hire a refrigeration contractor to fix any problems that go beyond the solutions we provide. We also identify additional energy projects and initiatives that can further reduce energy consumption.

“Finally, we issue a commissioning report. The report summarizes the work we’ve done. It identifies and recommends new opportunities for savings. And it forecasts likely savings from the recommended projects.”

About SINGH360 Inc.

SINGH360 (www.singh360.com) specializes in facility management. The principals have worked with the supermarket industry for 20 years, providing objective counsel that helps operators find and implement the best solutions to energy and maintenance challenges. The company’s solutions often incorporate the latest technologies. Services range from building-envelope assessments to complete design of mechanical and electrical systems (including HVAC, lighting and refrigeration systems) for new and existing buildings. The company help organizations set priorities for efficiency projects based on sustainability goals, speed of payback, and the return on investment. For more information, contact Abtar Singh, abtar@singh360.com or 651-605-1093.

Selecting a Power Meter: Find the Right Tool for the Job

“I need a meter.”

This is where the majority of customer conversations begin at DENT. When you learn that your project includes metering or logging energy consumption, it’s clear that you’ll need some piece of equipment to make that happen. Here’s a list of questions to help you decide which DENT meter is the right one.

QUESTION 1: HOW LONG WILL YOUR PROJECT LAST?

Is your project a 30-day load study or will you permanently be installing a meter within your building? The answer to this first question often dictates which meter is best for you.

If your answer is a 30-day load study, an energy audit, or a measurement and verification (M&V) project, the ELITEpro XC is a solid choice. The ELITEpro XC is portable and can be easily moved between panels or to a new location at the end of one project. This is why it’s often the best choice for a temporary study.

On the other hand, if you plan on permanently installing a meter for building submetering, tenant submetering, or demand response, the PowerScout 3037 or PowerScout 24 will be more suitable. The PowerScout is hard-wired into the panel (as opposed to connecting with croc or alligator clips), making it less portable than the ELITEpro.

QUESTION 2: HOW DO YOU WANT TO COLLECT THE DATA?

The ELITEpro and PowerScout instruments handle data collection in two different ways. How data is collected will likely have a large impact on which meter you decide to use.

The ELITEpro has 16 MB of on-board, non-volatile memory for data storage. Data is recorded as the metering session continues and, once the session is complete, the user can download the data from the meter using a USB cable, over Ethernet, or Wi-Fi (depending on meter configuration). Data is downloaded from the meter using a program called ELOG. Once downloaded, the data can be analyzed using ELOG or can be exported to Excel.

If you prefer walking up to the logger, connecting a laptop, and downloading your data, then the ELITEpro is the right choice.

By comparison, the PowerScout does not have any on-board memory for data collection. Instead, data is sent from the meter via Modbus or BACnet communications to a separate data logger or building automation and controls system. The PowerScout can use either BACnet IP or MS/TP protocol or Modbus TCP or RS-485 protocol for sending commands or retrieving data.

If your preference is to interface with the meter through your building automation system or via a remote dashboard display, the PowerScout is right for you.

QUESTION 3: HOW MANY PHASES DO YOU NEED TO MEASURE SIMULTANEOUSLY?

Are you measuring single or three-phase loads? How many of each do you wish to monitor simultaneously?

With the ELITEpro or PowerScout 3037, you can measure single phase loads or one three phase load. The PowerScout 24 allows for up to 24 single phase or 8 three-phase or a combination of single and three-phase using any mix of CTs.

If you require on-board memory (ELITEpro), but need to measure more than one three-phase load at a time, using multiple ELITEpros may be your best option.

QUESTION 4: DO YOU REQUIRE REVENUE GRADE ACCURACY?

The PowerScout 3037 is a revenue grade meter with accuracy of 0.2% or better (ANSI C12.20-2010 qualified Class 0.2). The PowerScout 24 is revenue grade with accuracy of 0.5% or better (ANSI C12.20-2010 Class 0.5).

The ELITEpro accuracy is better than 1%, which is ideal for energy audits, load studies, and M&V work.

QUESTION 5: WHY CAN’T I JUST USE A SMARTLOGGER INSTEAD OF AN ELITEPRO OR POWERSCOUT?

Actually…you can, under certain circumstances. But it’s important to understand what the SMARTloggers were designed for and their limitations.

SMARTloggers are time-of-use loggers. They are designed to give you run-time information for a load. There are four different “flavors” of SMARTlogger:

  • CTlogger: Has an external CT for using on energy-consuming devices with a power cord
  • LIGHTINGlogger: Has an internal photo-sensor for measuring on-time of lights
  • MAGlogger: Measures on-time for motors (or anything generating a magnetic field)
  • CONTACTlogger: Has dry contacts for monitoring closures (such as with a door or switch)

Take the LIGHTINGlogger, for example. If you have the LIGHTINGlogger installed in your light fixture, it’s going to sense when the lights turn on and off. It will record that information with a time and date stamp. Once you download the data from the logger using SMARTware, you will see the on/off transitions for the light. Maybe your light was turned on at 12:38 AM and turned off at 12:58 AM. It’s easy to see exactly how long your light was on. Here’s a sample of the data output:

All SMARTloggers work in the same manner, but are designed to monitor other types of loads, as outlined above.

What happens when you want to know how much energy your light was consuming. The logger itself doesn’t tell you this information without doing some post-processing. You can set the connected load’s kW in SMARTware software to make an estimate on energy consumption.

This is the real difference between the SMARTloggers and a true power meter, such as the ELITEpro or PowerScout: The SMARTloggers will only be able to give you an estimate on energy usage based on the time a load is on multiplied by how many kW you input in the software. If your question is, “How long has my pump been running?” and not “How much energy is my pump consuming?” then the SMARTlogger is an excellent choice.

QUESTION 6: I’M STILL NOT SURE WHICH METER TO CHOOSE. HELP!

Give DENT Instruments a call and we will help you find a solution for your project. Also, be sure to download our  FREE Metering Project eBook for time & money-saving tips for your next project. The eBook also features multiple checklists to keep you project on track.