10-Step Checklist for ElitePro Power Meter Verification [Download Available]
INTRODUCTION: Whether this is your first metering project or you're [...]

INTRODUCTION: Whether this is your first metering project or you're [...]
INTRODUCTION: If you've spent time sourcing and installing power meters, [...]
There's nothing more frustrating than arriving at the project site [...]
I belong to a church where we recently did a [...]
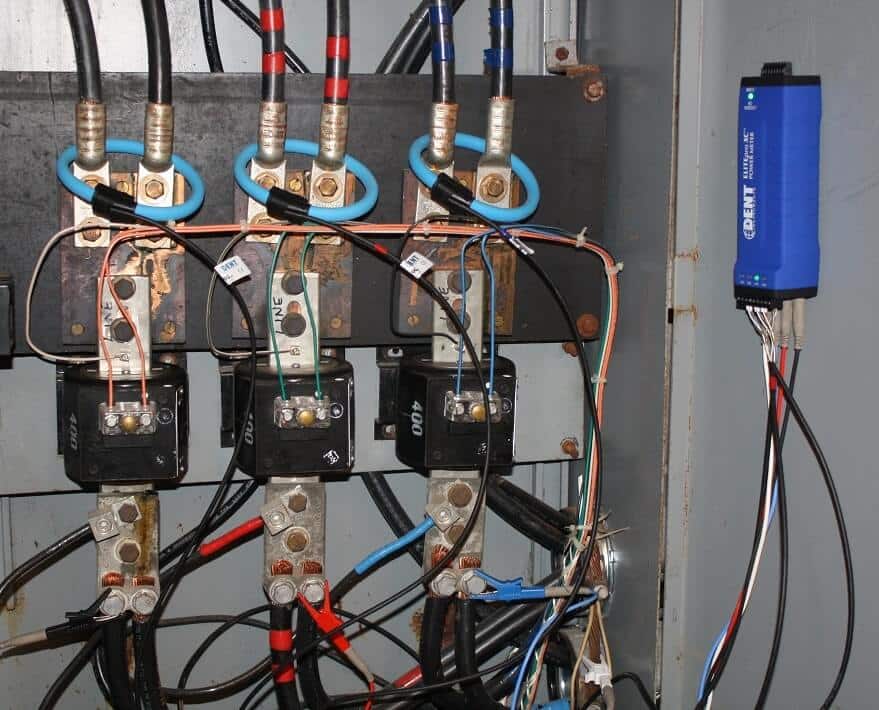
By: Zack Smith & Allan Evora, Affinity Energy ATS MULTI-CIRCUIT [...]
CUSTOMER PROFILE Founded in 1901 and now part of the [...]
Two prominent grocery chains in the Upper Midwest are reducing [...]
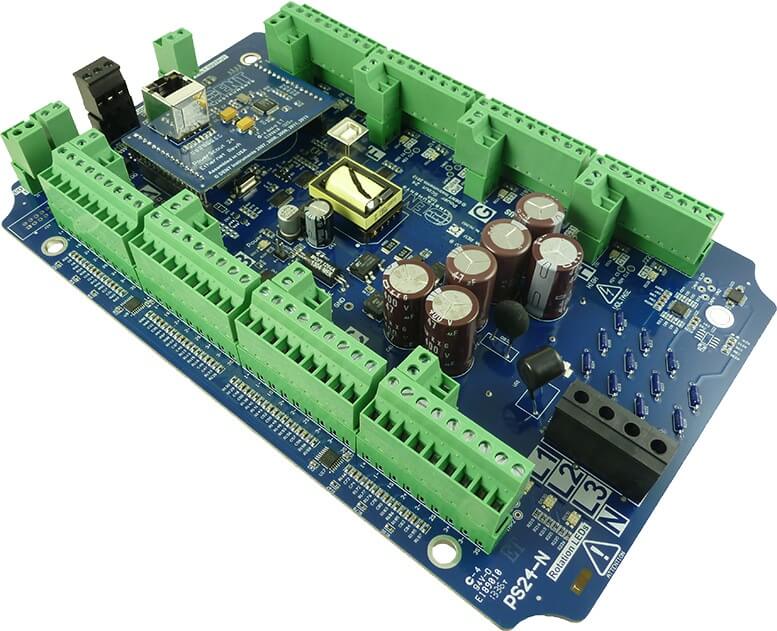
"I need a meter." This is where the majority of [...]